APAC SMA 2015 - Q3
Android leads across APAC, iOS leads in Australia
Insights presented by Opera Mediaworks in partnership with the Mobile Marketing Association
As of the close of the third quarter, Opera’s reach in Asia Pacific (APAC) and Oceania is over 400 million unique users each month. The APAC region is the largest global market on our platform in terms of unique users. However, it is no. 2 when measured by impressions served and no. 3 for revenue generated. Despite its inclusion of mobile-marketing powerhouse Australia, Oceania, because of its small population, still trails the other global regions as a combined entity.
For this State of Mobile Advertising report, presented in collaboration with the Mobile Marketing Association, we provide an overview of mobile advertising performance in APAC and Oceania* focusing on our “P6” countries in APAC (India, Indonesia, the Philippines, Malaysia, Thailand and Vietnam) and Australia in Oceania. We will include a breakdown of traffic and revenue by OS platform, top publisher and mobile-app categories, and insights into the mobile behavior of four types of mobile users (i.e., audience segments).
Mobile-device market share and ad types
The feature phone still lives – but only monetizes well in India
On a global scale, Android is the clear winner, dominating the market in both active users and impression volume. However, in Asia, there is still a significant presence of older, non-“smart” devices – accounting for 30.4% of all impressions served in the P6. Though the market share of these feature phones is declining, we can still see robust usage in Vietnam, Indonesia and the Philippines.
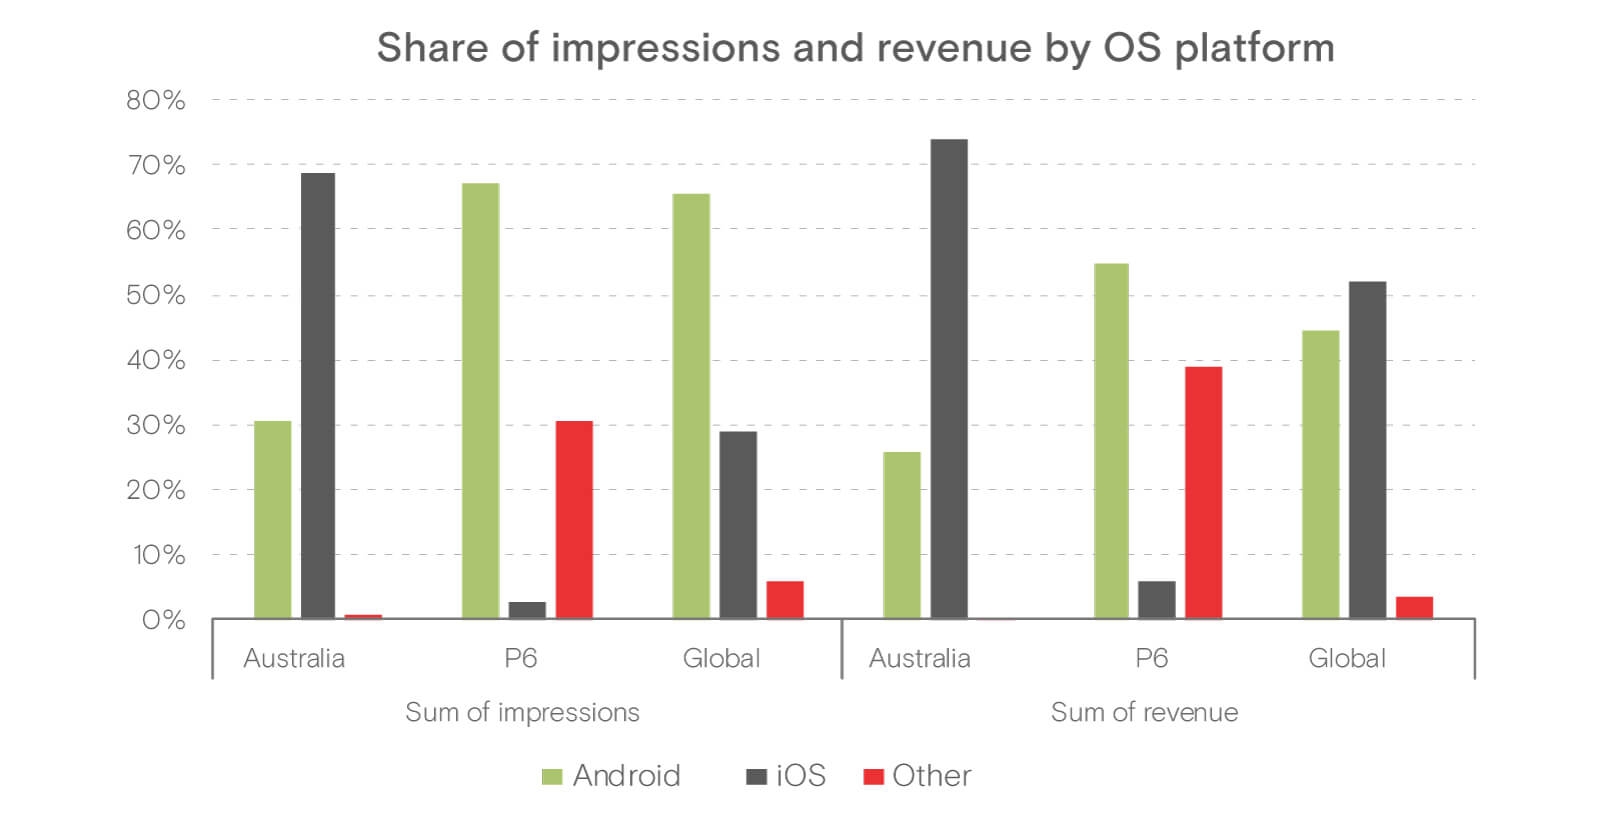
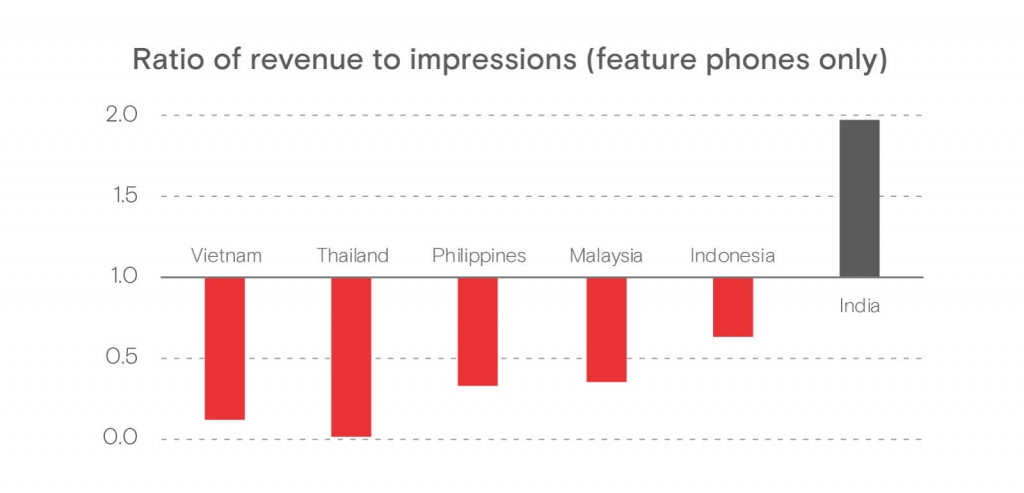
Feature phones are not particularly valuable for mobile advertising due to their limited capacity for rich-media and video ad impressions, so the monetization potential (ratio of revenue to impressions) in most of these markets is poor. India is the only country where platforms outside of Android and iOS support a relatively strong monetization model, with platforms other than Android and iOS having a share of revenue that is nearly twice their share of impressions.
Mobile video advertising lifts monetization levels
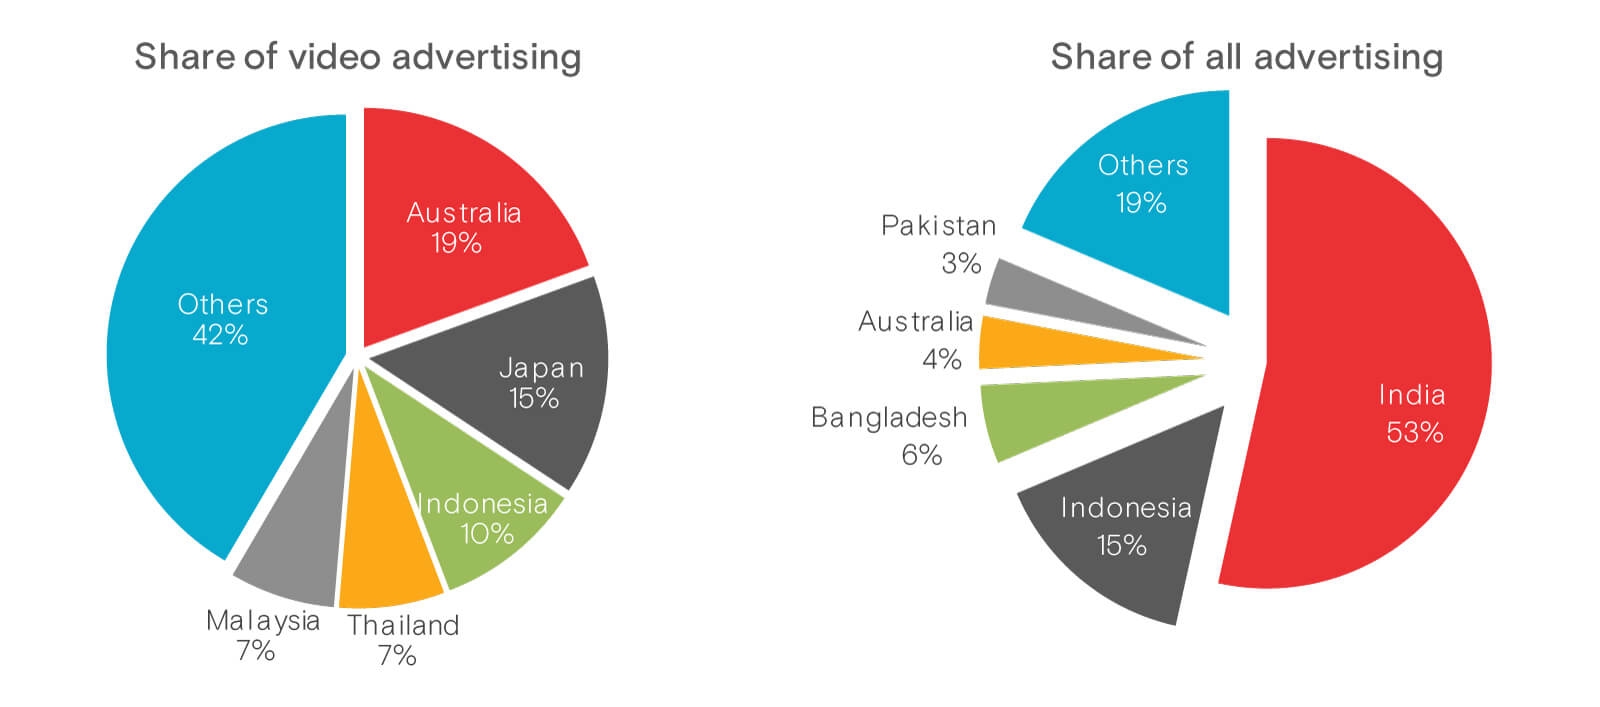
Among the seven countries we focus on in this report, India has the most impressions and revenue. However, when looking only at monetization potential, India falls well behind others in the region.
As noted above, much of this reduced opportunity stems from the continued prevalence of feature phones and their limited capacity for rich-media ads such as video. Video is a high-impact and valuable advertising type, commanding higher eCPMs than other ad types in most countries. The only exception is Malaysia, where display ads are on top. Below we can see the volume of impressions and pricing for video, display and native ad formats across the seven countries for brand advertising.
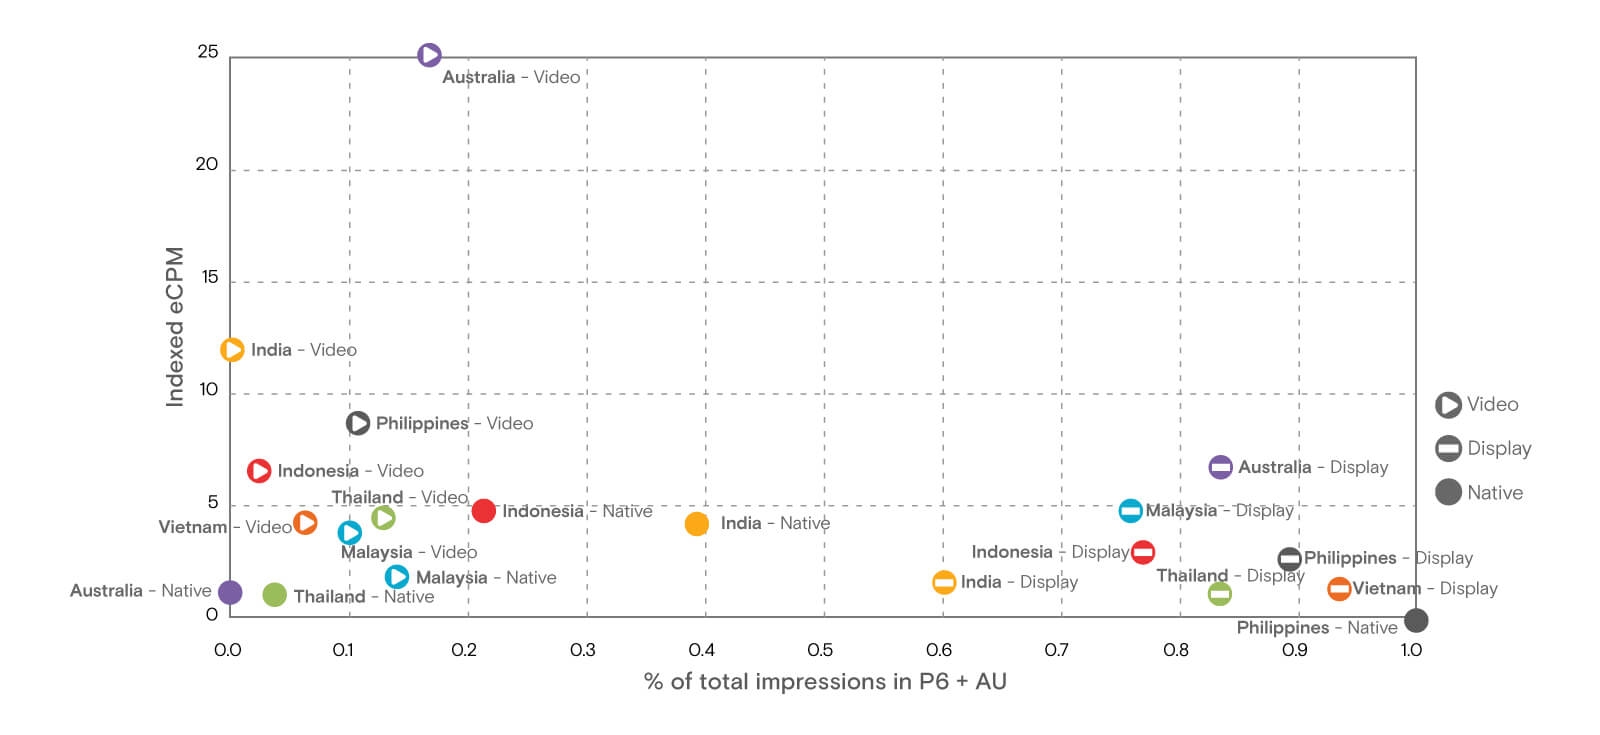
Australia has the highest ratio of video ad impressions to overall impressions and is currently the global leader in revenue driven by video, with a disproportionate amount coming from that ad type.
Still, there are markets, like Thailand and Indonesia, that have relatively high percentages of video ads being served, but, because they also have very high usage of feature phones, their overall monetization potential is somewhat stunted.
Top publisher and mobile-app categories
To find what mobile users in APAC and Oceania are using their phones for the most, we looked at the top-three mobile site and app categories visited in each of the seven countries in this study. This resulted in seven leading regional categories:
News & Information, Technology & Computing (Utilities), Sports, Social Networking, Mobile Stores & Carrier Portals, Games, Entertainment
By charting the volume of impressions served to each of these categories, we can see the profile of each country and gain a deeper understanding of how consumers in those countries use their mobile devices.
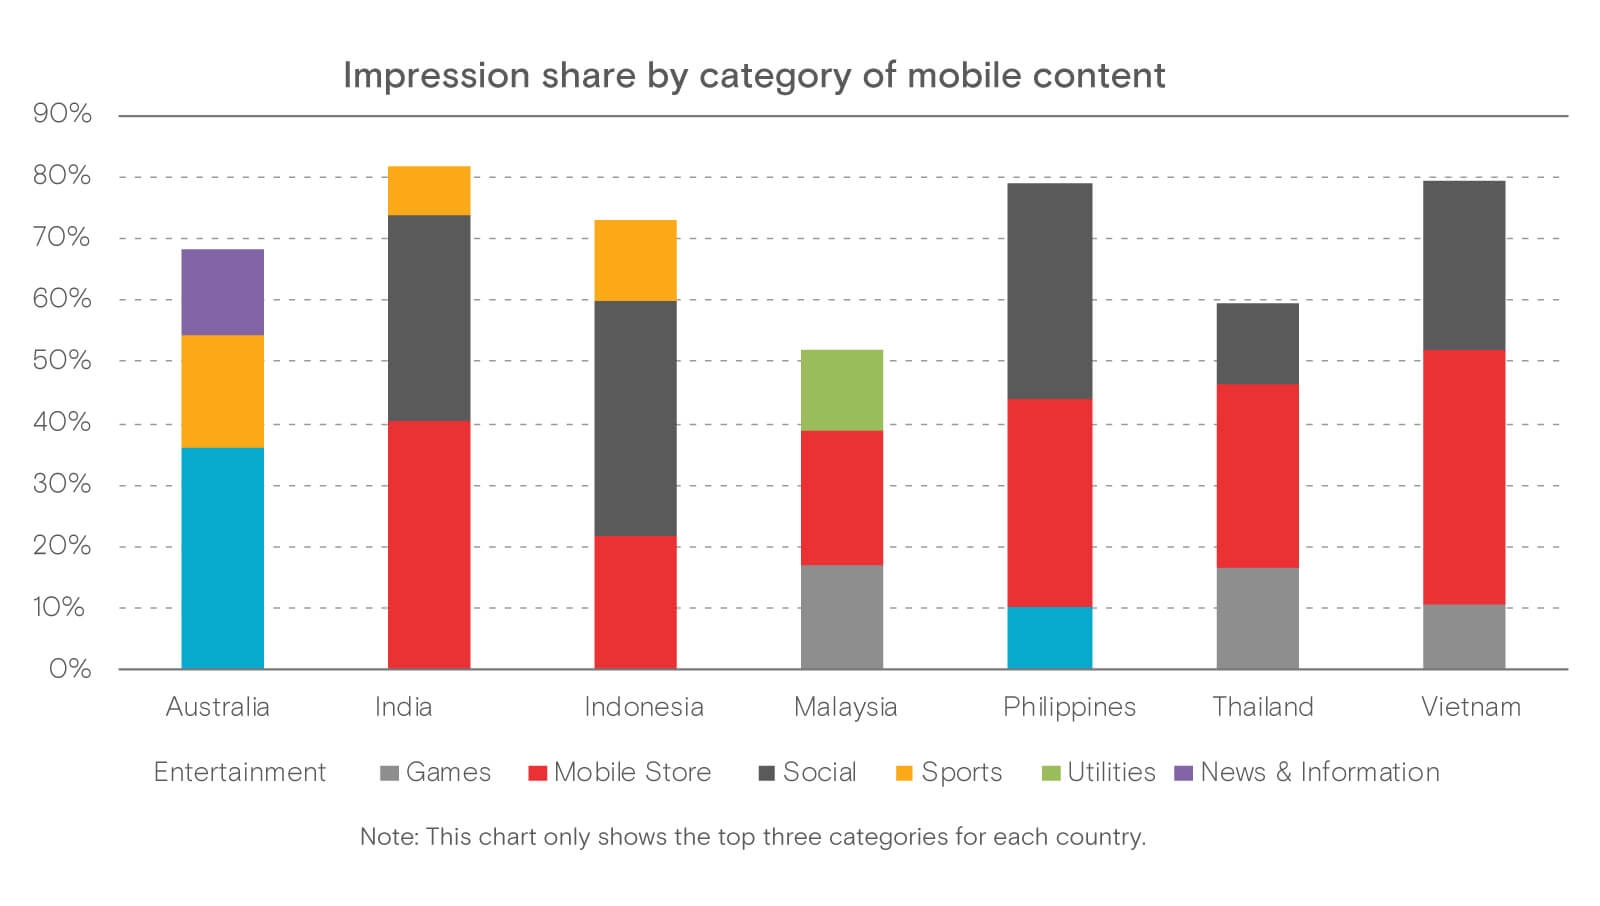
The first observation is that each country we analyzed has a different content interest profile. While the country pairs of India & Indonesia and Thailand & Vietnam show similar categories of audience interests, each country has a different ranking order of interests. Only in the case of Thailand and Vietnam did we see the same three top categories and the same number one category: Mobile Stores and Carrier Portals*. This is likely due to their close geographic proximity and the continued use of less-capable feature phones in those markets.
Mobile content trends by country
India
Users in India are most heavily engaged with the Mobile Stores and Carrier Portals category, followed by Social Networking sites and apps. Sports rounds out the list in the no. 3 position, but still making an appearance in the charts, whereas this category is noticeably missing in the profiles of most other countries (except Australia and Indonesia).
Indonesia
Indonesian users’ site and app category preferences are very similar to those seen in India. However, Indonesia places the first priority on Social Networking sites and apps (38% share) and places Mobile Stores and Carrier Portals second (22%). Similar to India and Australia, the Sports category closes out the rankings.
Australia
Sports takes up a fair share (18%) of Australians’ mobile visits, just topping News & Information (14%). However, the largest category by impressions served in Australia is Entertainment, with a 36% share.
Malaysia
Mobile Stores and Carrier Portals is the most popular category, followed by Games, at a 17% impression share. Malaysians were the only users to have a significant use of the Utilities category, at 13%.
The Philippines
Social Networking and Mobile Stores and Carrier Portals are neck and neck for the most popular areas, with each capturing about a third of total impressions in the country. Entertainment was no. 3, with about 1 in 10 ad impressions going to that category. It is the only country in the region outside of Australia to show a significant interest in Entertainment.
Thailand & Vietnam
These countries demonstrate some similarities: both are dominated by Mobile Store and Carrier Portal visits. However, in Thailand, Games is the second-most popular category, followed by Social Networking – whereas in Vietnam, Social follows closely with a relatively high 27% share, and Games places third.
Broader insights across the region
Mobile Stores and Carrier Portals was the most common interest category, taking the no. 1 spot in six of the seven countries. Australia was the exception, with the most traffic to Entertainment; mobile stores were not even represented in its top three.
Some countries (India, the Philippines and Vietnam) all have highly condensed interest areas, with close to 80% of impressions served to the top three categories. Malaysia and Thailand, on the other hand, have more highly distributed interest profiles, with more traffic going to a wider set of categories.
Asia is the global leader in driving users and traffic for mobile storefronts and carrier portals. Most of these users have the older feature phones noted above and therefore have fewer choices for accessing content and apps than their smartphone-owning counterparts. In fact, nearly 89% of the unique users of mobile stores and carrier portals are on “Other” (feature phone) platforms, and just 11% come from Android phones.
Audience behavior and interests
Analyzing contextual attributes of users by measuring the performance of the different categories of sites and apps is one way to gauge audience size and interest. However, for advertisers, a more detailed analysis of behavioral characteristics is needed to identify the audience segments that meet campaign objectives. For example, while Social and News & Information may be popular in terms of visits and unique users, they do not identify interesting segments for a brand advertiser.
Top audience segments
Extensive reach and depth of engagement with a wide variety of sites and apps powers the ability to create intelligent audience segments for advertisers. (To see the methodology of this approach, see our report on Intelligent Audience Creation.)
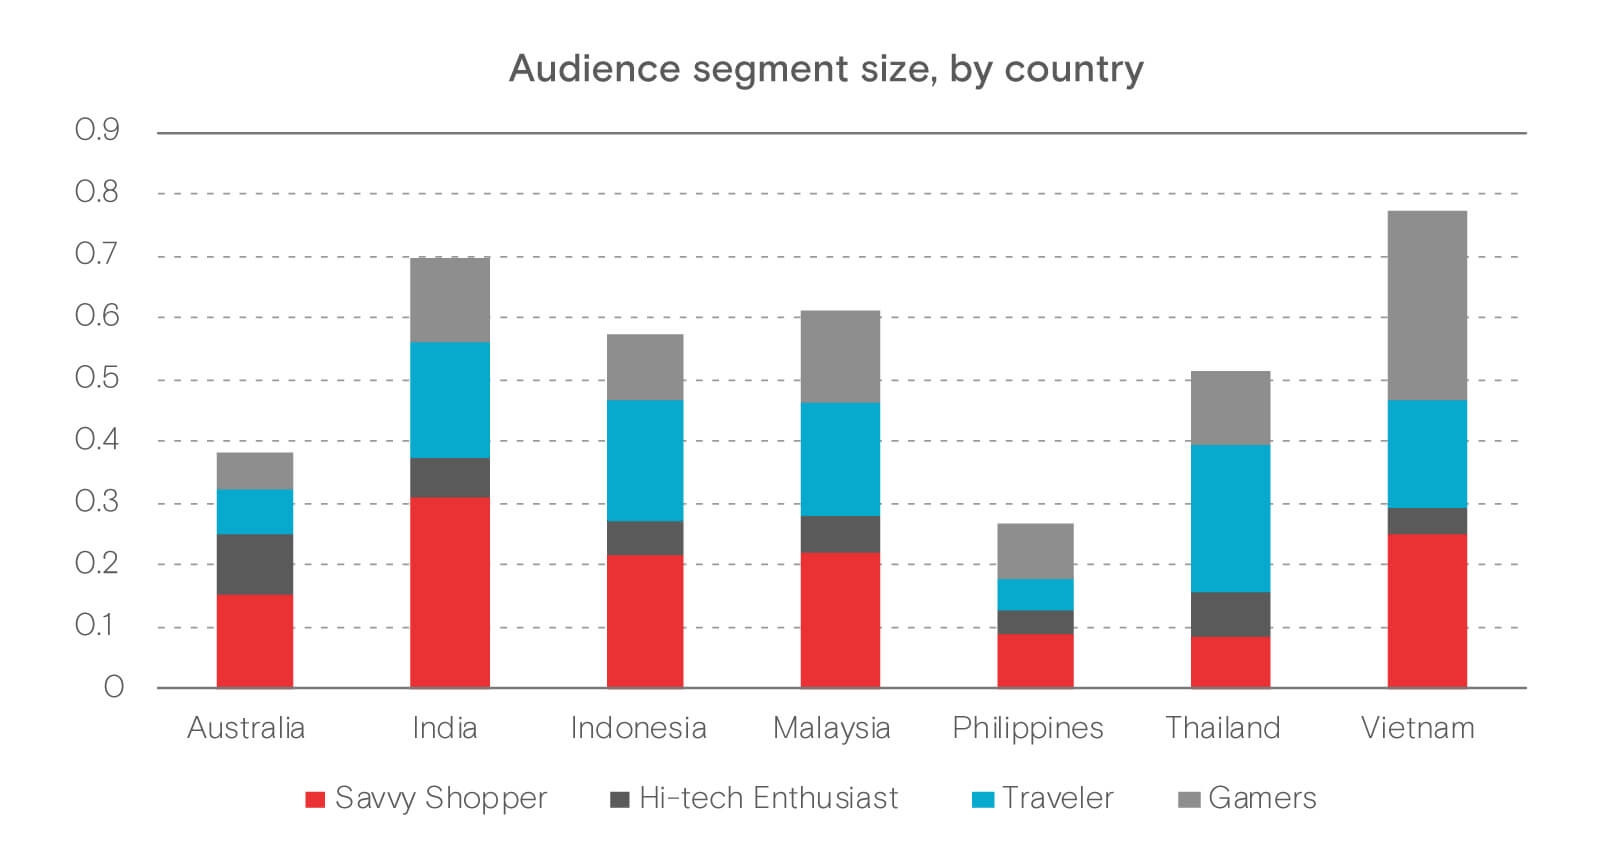
A few of the most common and desirable audience segments for advertisers are: Savvy Shoppers, Travelers, Gamers and High-tech Enthusiasts. The chart below shows how these audience segments are represented within each of the markets in this study. The shares shown represent the percentage of the total audience in each country that we define as a member of that audience segment.
Observations from this breakdown:
India and Vietnam have a very high percentage of users that fall into one of these four audience segments. This corresponds with a relatively high concentration of site use in these countries, as described in the previous section.
In the Philippines, however, the top sites and apps attract a high percentage of total users, but those users have a very wide range of interests, as revealed by the smaller sizes of these four audience segments. This implies that this market has a very pronounced “long tail” for the use of sites and apps across the population. In other words, while most visits can be seen on a small number of site categories, those users demonstrate a wide variety of secondary interests, which results in smaller and more specific audience segments.
Audience snapshots: Gamers and Savvy Shoppers
Gamers lean toward iOS in Australia, but Android elsewhere
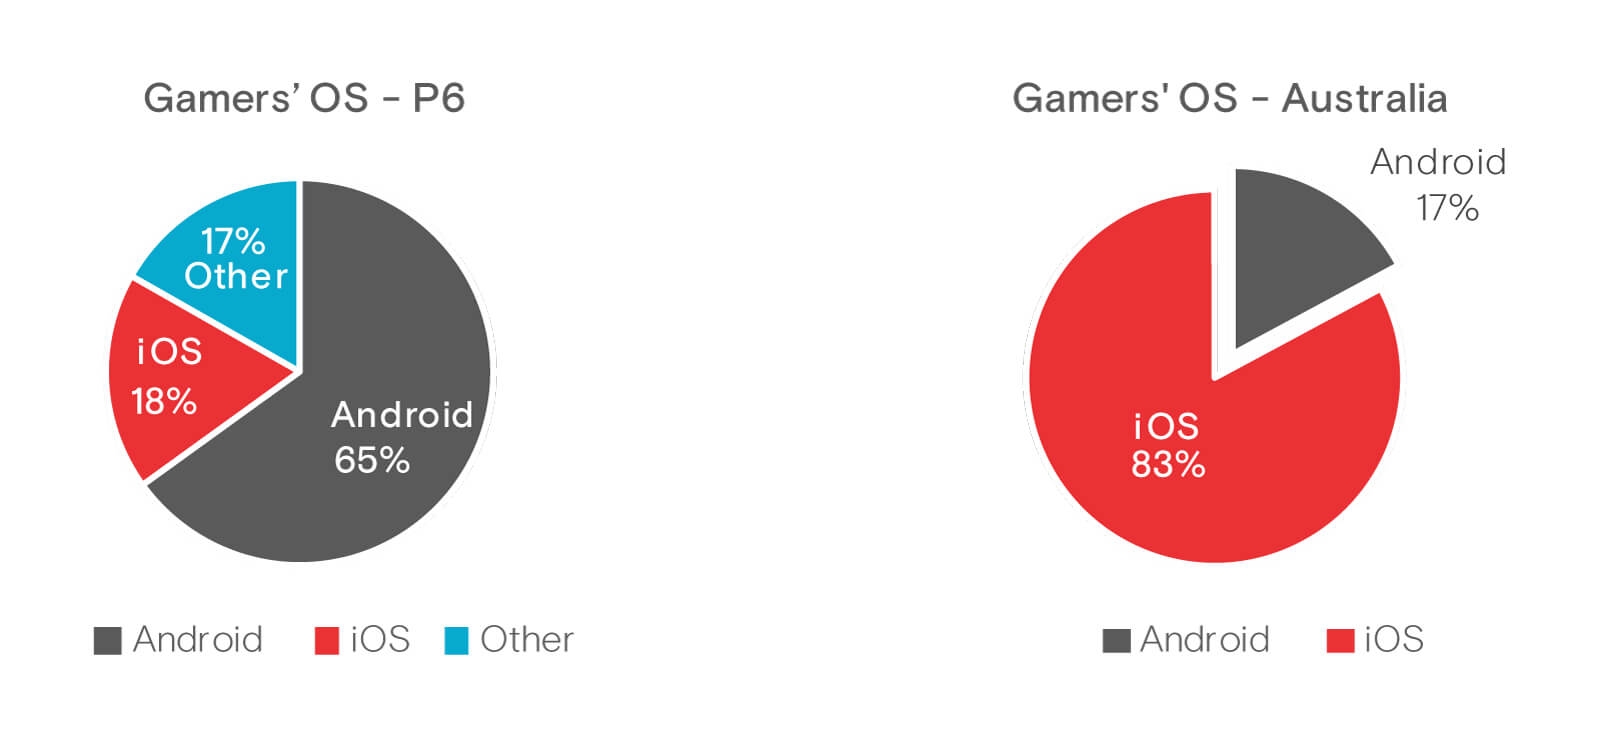
Taking a closer look at one segment, Gamers, we can see that there is a clear distinction when it comes to preferred operating system. In Australia, the vast majority of Gamers (83%) are using Apple devices, with just 17% on Android. In contrast, Android is the dominant OS for Gamers residing in the rest of the countries in this study, with 65% using Android-powered devices, 18% on iOS, and nearly 17% using “other” devices.
No. 1 gaming app = Cut the Rope
Homing in on the Gaming category and looking at the most popular sites and apps among Gamers, it’s clear that Cut the Rope is the winner, taking the no. 1 position in all of the P6 countries. Talking Tom and Subway Surfers also show up frequently in the top three games.

Savvy Shoppers in four countries
India, Indonesia, Malaysia and Vietnam all contain a significant number of users that fit into the Savvy Shopper segment. The most popular shopping sites in these countries are shown below.

APAC audience profiles
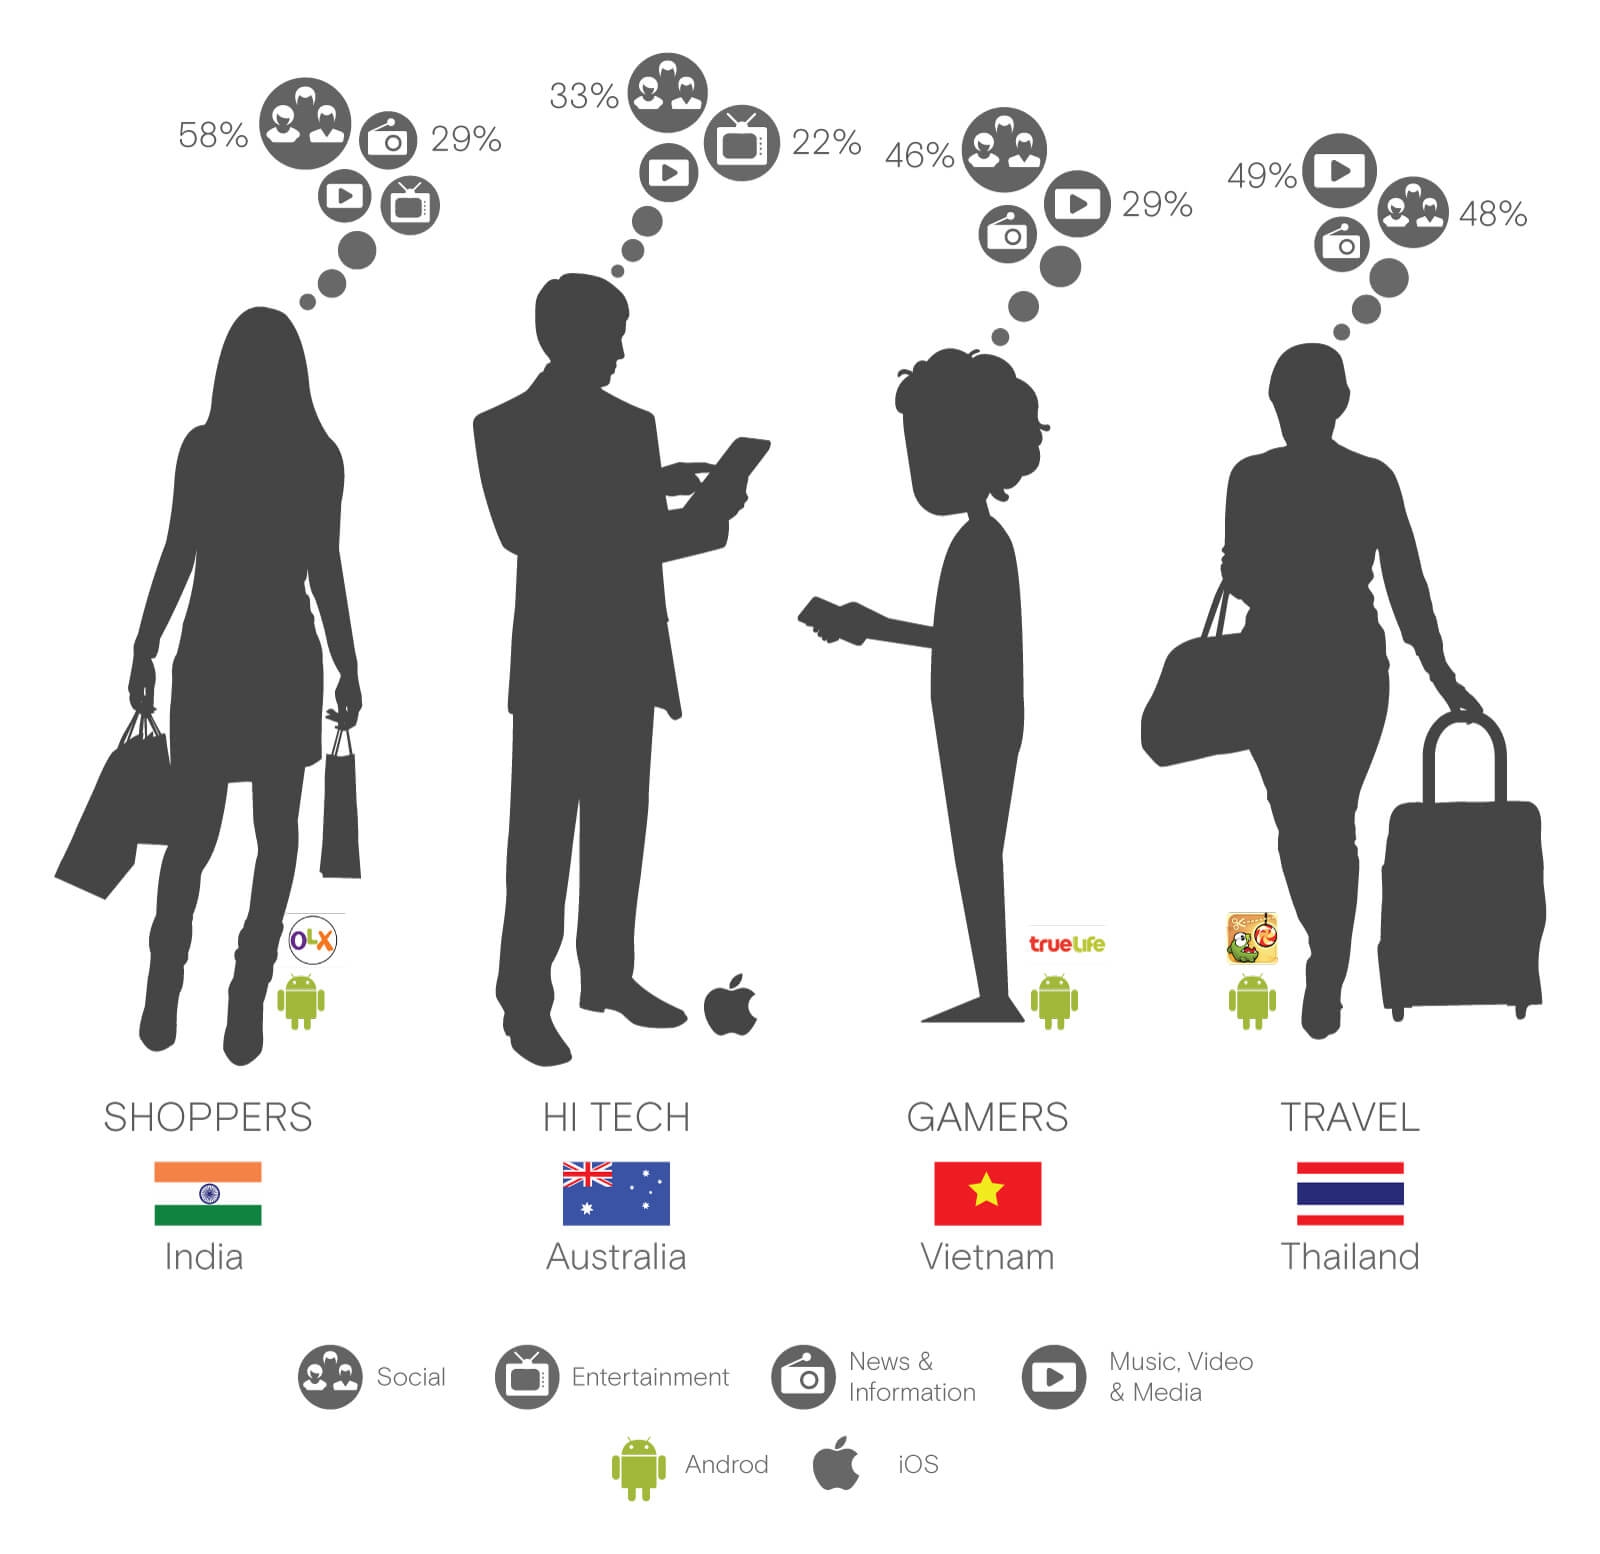
The images reveal a profile for which each of the four audiences had the largest representation across the countries analyzed (P6 + Australia). As seen here, Social was the top content category among nearly all of the profiles, with the exception of Thailand, where Media prevailed. However, all four had different secondary interests.
Methodology
Information contained in this report is based on aggregated information obtained from the Opera Mediaworks mobile advertising platform and mobile ad exchange servers. The data presented represents traffic and monetization metrics and statistics compiled across multiple advertising campaigns delivered by us to our mobile publisher customers. The data includes ads requested from and delivered by us on behalf of multiple ad networks, as well as directly sold campaigns created by our customers themselves. Country-level details are based on IP addresses of the originating ad requests as forwarded to us by our mobile publisher/app developer customers. Device details are similarly based on device user agents provided by these same customers.

