REPORT: TRENDS AND BENDS IN MOBILE ADVERTISING
Data from the last quarter of 2014 showed us that the most popular guy isn’t always the richest, that sometimes it is all about fun and games, and that the players are always changing.
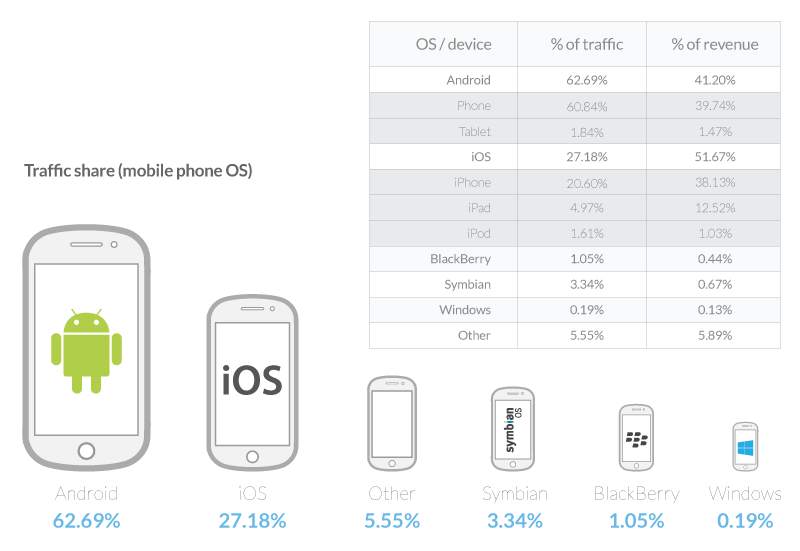
Throughout 2014, we saw a big change in which device operating system captured the most ad traffic and which earned the most revenue. According to our Q4 Opera Mediaworks State of Mobile Advertising report released today, it was Android that nabbed the majority (62.7%) of mobile ad traffic in Q4, with more than 6 in 10 ad impressions served on mobile devices using the Google OS.
This number marks a significant change from 2013, when Android captured 37.7%, falling short of iOS’s 43.4%. But fortunately for Apple, Android’s success doesn’t come at their expense. Instead, Android is eating up the shares formerly taken by BlackBerry and other older generation feature phones.
In Q3, we saw that Android began closing the gap in revenue generated, rising to nearly 42% of total revenue compared to iOS’s 51.2%. Still, Q4 proved to be a good quarter for Apple, which retained a solid lead for revenue generation and monetization with a 51.7% share compared to Android’s 41.2%.
Apple’s firm grip on revenue generation has been driven to a large extent by its favorable market position in Western markets, such as the United States, Germany and the United Kingdom. The iPad bring Apple some good news as the device continues to demonstrate impressive monetization capabilities, accounting for nearly 13% of revenue with a mere 5% of impressions.
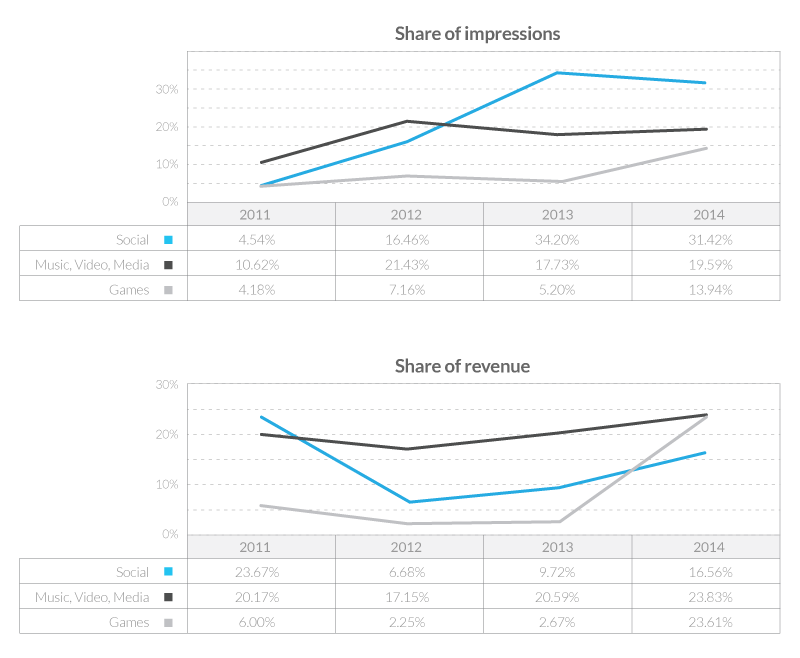
So just which mobile applications and sites are drawing the traffic and revenue? No major surprises; all three of the usual suspects — Social Networking; Music, Video & Media; Games — were all present and accounted for. But when it came to the race within the race, things are actually a bit more interesting. In 2013, the Games category represented just 5% of impressions, but in 2014, it jumped to nearly 14% in Q4. And its revenue numbers were even more impressive, as the category grew from just 3% last year to 21.4% of revenue in Q4 of 2014.
The type of sites and apps inhabiting the mobile ecosystem are changing, but the report also shows how the ecosystem itself is transforming. Just several years ago, the United States was overwhelmingly the largest market as measured by impression volume and revenue generation. But recently there has been a shift in market patterns, as other global markets are beginning to capture more market share.
While the U.S. still dominates the global mobile ad economy, with nearly 44% share of impressions, Asia Pacific came in hot at 26.1% in Q4. And by the end of 2014, the non-U.S. Americas also emerged as a respectable mobile advertising market, with a 9.8% share of impressions. Even Africa, which had only a mere 1% share at the end of 2013, witnessed a tremendous growth, finding its way to 4.8%.
The changes underscore the trend towards true “globalization” of mobile advertising, opening up an entirely new breadth of possibilities for both traffic and revenue generation.

